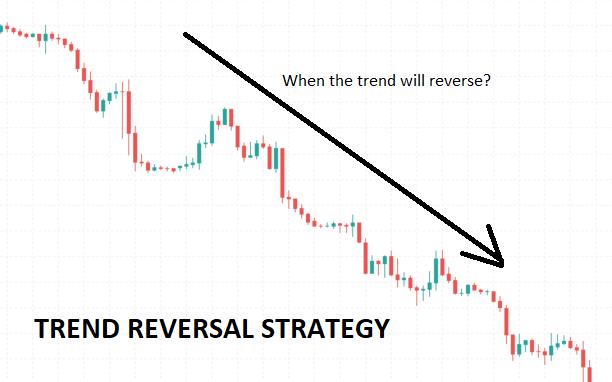
What is Trend Reversal Strategy – Is it successful in forex trading?
Trend reversal trading strategy is a very attractive trading strategy which in case it is applied correctly can achieve high win rates and consistent profits. As always, a solid trading plan is needed with wise take profit and stop loss limit levels since market conditions may suddenly change.
At this article, we will analyze all the respective information a trader needs to comprehend to apply a Trend Reversal Strategy and we will mainly focus on the technical analysis parts.
The direction of a Market’s trend is usually shown with the use of Moving Averages (MA) which indicate if a Market is in an uptrend or moving downwards. The main idea of the Trend Reversal trading strategy is to open position(s) and trade(s) opposite of the current market trend. For opening such positions though, we need to examine carefully all the available information and data and confirm that indeed the trend will reverse and not continue in the same direction. The goal is to place the order(s) exactly when the trend is losing its momentum and shows signs of potential reversal.
Some basic rules and methods based on checking several trend indicators, in regards Trend Reversal trading strategy, are the following:
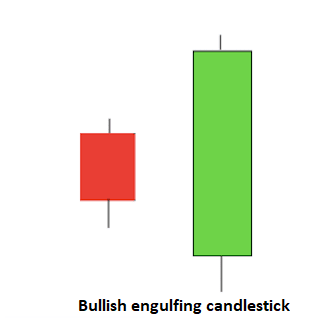
Candlestick patterns: Traders often try to find specific candlestick patterns which indicate a potential trend reversal. Such patterns may be hammer, shooting star or engulfing patterns.
Support and resistance levels: Key support and resistance levels can act as signals for possible trend reversals. Traders spot these price key levels and monitor the price action near them, looking for signs of a break or bounce that could indicate a change in the general price direction.
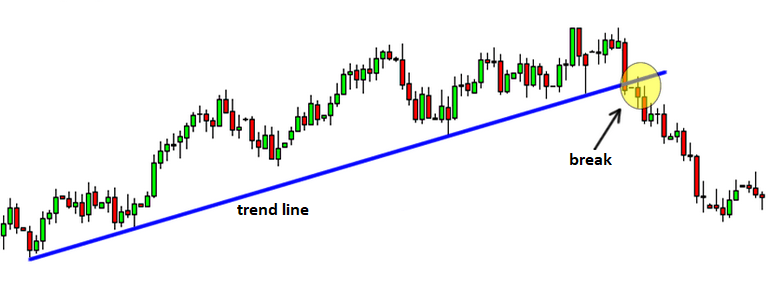
Trendline breaks: Trendlines are drawn on a price chart to connect successive highs or lows. When a trendline is broken, it can suggest a potential trend reversal. At the following example, we can spot and uptrend, and the spot where there is a break on the general trendline.
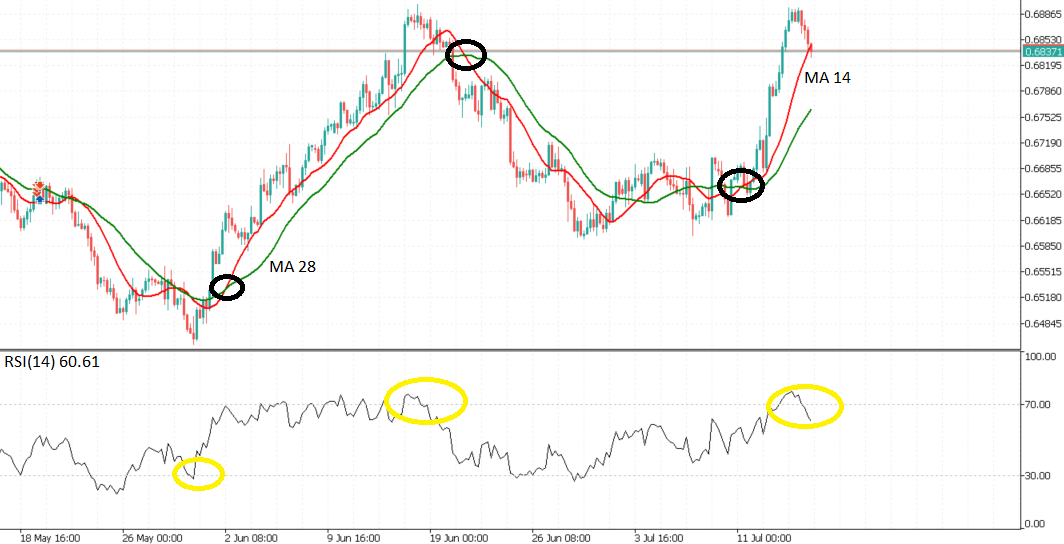
Oscillators: Technical indicators, like the Relative Strength Index (RSI) or the Stochastic Oscillator are used to identify overbought or oversold areas and price conditions. When an oscillator reaches extreme (high or low) levels, it may indicate that a possible reversal is about to happen.
Divergence: Traders can spot a divergence when a price of an asset moves in one direction, but an indicator is moving in the opposite direction.
The main idea of a Trend Reversal trading Strategy can be summarized following these steps. First a trader needs to identify a trend (downtrend or uptrend). This can easily be done by checking a price chart for lower lows (downtrend) or higher highs (uptrend). Then, potential reversal patterns can be detected as explained above (e.g. trendline breaks, engulfing candlesticks, etc). Finally, trades can be placed with careful Stop Loss and Take Profit limits, in order to guarantee trading profits and minimize any potential loss in case the market moves against our trades.
It is important to note that actual trading decisions should be made upon careful analysis, considering multiple factors, and having a risk management strategy. Finally, it is wise to always test any strategy on a demo or test account before applying it to a real trading account. Practice accounts are useful to check settings and parameters and also spot examples of fake signals.