Fibonacci – Forex trading and Retracement levels
The Fibonacci sequence is the art of mathematics, where each number of the sequence is the sum of the two (2) preceding numbers (e.g. 0, 1, 1, 2, 3, 5, 8, 13, 21, 34, 55, etc). In forex trading, the Fibonacci indicator is one of the most popular tools-indicators. Traders can use it, to identify potential levels of support and resistance on price charts.
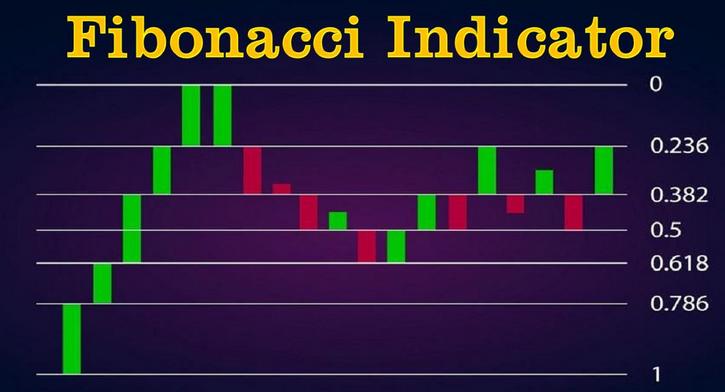
Traders can use Fibonacci ratios derived from the Fibonacci sequence to identify significant price levels in a trend. The most used Fibonacci ratios in forex trading are 38.2%, 50% and 61.8%. These levels are the result of dividing a number of the Fibonacci sequence by the number that follows it. Traders often look for potential retracement levels where a pair price may temporarily reverse before continuing in the direction of the trend.
To draw the Fibonacci indicator at a trading platform, we should follow the following steps:
- Identify a Trend: We first need to spot significant lows and significant price highs plotted on a chart, within a specific time frame. Spotting the current trend is important, either is a downtrend (lower highs and lower lows) or an uptrend (higher highs and higher lows).
- Select Swing High and Swing Low: Once the trend is identified, we then need to find the most recent swing high and swing low points within that trend. The swing high is the highest point reached before a downward move, and the swing low is the lowest point reached before an upward move.
- Apply the Fibonacci Retracement Tool: At the top menus of MT4 or MT5 trading platform, the Fibonacci tool can be found (e.g. at MT5 platform, View-Toolbars-Line Studies). Once we select the tool, we click on the swing low point and drag the tool to the swing high point for analysis of an uptrend. In case of a downtrend, we click on the swing high and drag to the swing low.
- Analyze Fibonacci Levels: The Fibonacci retracement levels (typically 38.2%, 50% and 61.8%) will be automatically drawn at the chart. These levels represent potential areas where the price might experience retracements or reversals. Traders often watch for price reactions at these levels.
- Monitoring Price Action: Once Fibonacci levels have been drawn, traders need to pay attention on how the price interacts once these levels are reached. If the price retraces and then bounces off at one of the Fibonacci levels, it could indicate a potential support or resistance level. Traders may look for additional confirmation signals, like other technical indicators, before making trading decisions.
- Set Entry and Exit Points: Based on the analysis of the Fibonacci levels and along with other factors, traders can set entry and exit points for orders. For example, a trader may decide to enter a long trade (buy), when the price retraces to the 50% Fibonacci level while the price shows signs of bullish reversal and set a stop-loss below the swing low point.
Having the following graphical example which refers to EURUSD, daily chart, we can see that the EURUSD price consolidated at the 23.6% Fibonacci level and then continued to move in the same direction as the current trend (uptrend). We can clearly see that this level (23.6%) is now a new support level for EURUSD price.
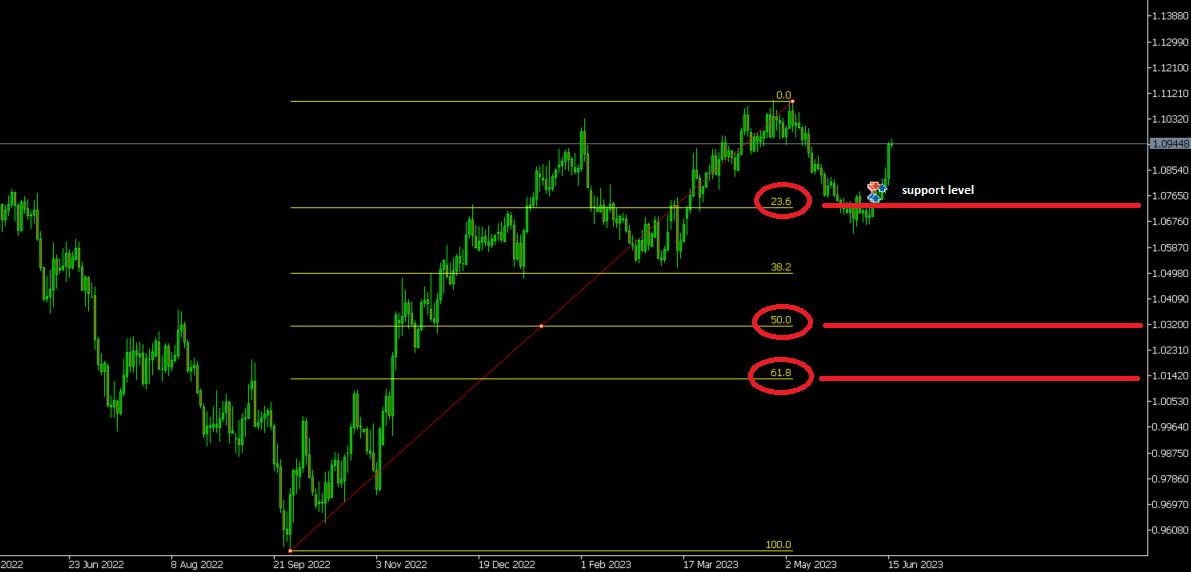
It is important to note that Fibonacci retracement levels indicate where a price might find support or resistance. There are no guarantees that the price will stop there. A prudent trader will take into consideration these levels as entry or exit points while increased price movement and volatility are likely to be expected at these levels.
In essence, Fibonacci retracement levels indicate key areas where we can spot price retracements, make more accurate assessments for entry points or identify stop loss levels. Market movements are highly unpredictable, while other factors also need to be considered in conjunction with risk management strategies.