Forex Trading Charts
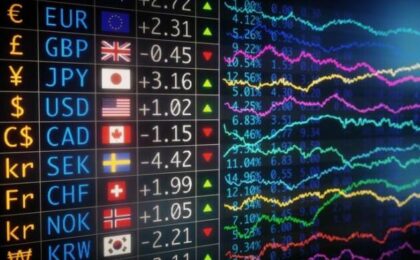
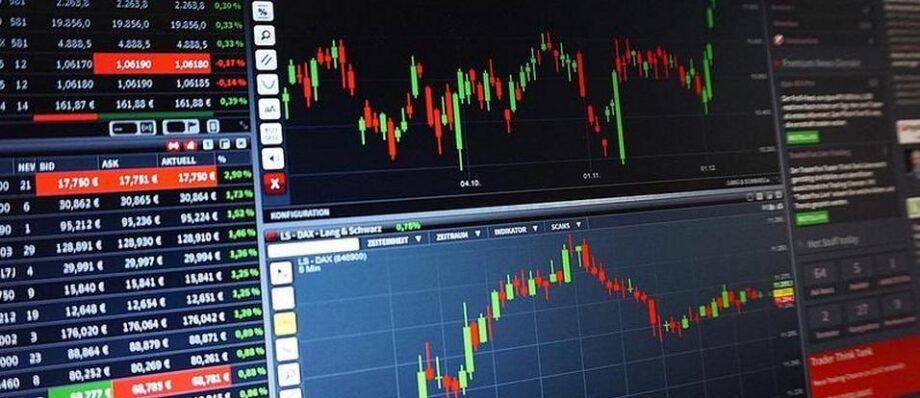
There are many platforms developed for traders which offer many special features and services. Using a trading platform and a forex trading chart traders try to analyze the market and to identify any possible trends or price movements.
In this article, we will state the main types of forex charts.
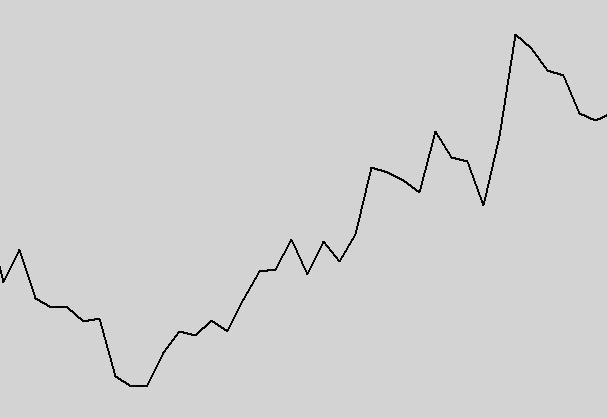
Line Charts
The simplest form of forex charts is the line charts. They provide a basic overview of price trends by displaying a single line connecting the closing prices of each period. Line charts are the most basic form of charts and lack detailed information.
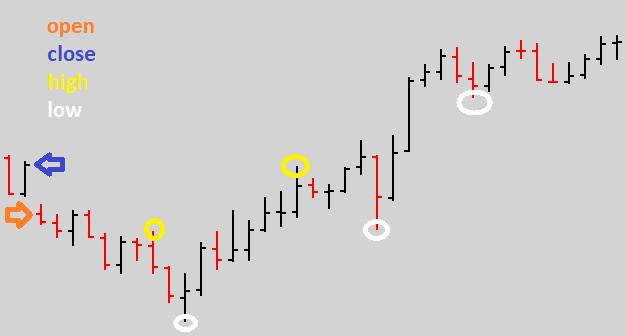
Bar Charts
Bar charts display information for each period as a vertical bar. Traders can also check some additional information for Open-High-Low-Close (OHLC) prices for each bar. The top part of the bar represents the highest price reached at each period, while respectively, the bottom part of the bar shows the lowest price reached. The small horizontal line on the left side of the bar indicates the opening price and the horizontal line at the right side the closing price.
Candlestick Charts
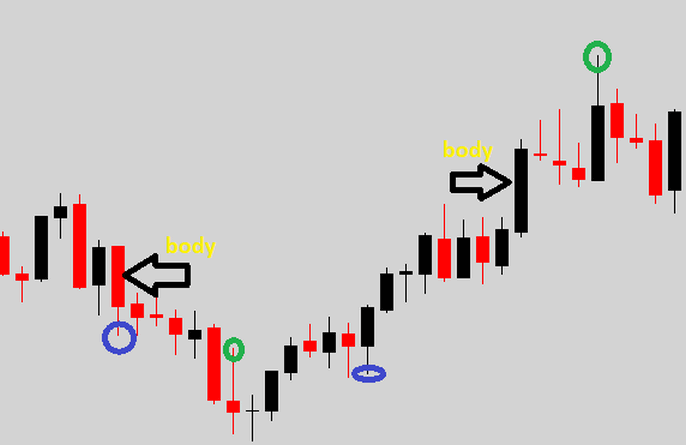
Most traders use candlestick charts since they display a lot of useful information. Like bar charts, each candlestick represents price movements during a specific period. The ‘’body’’ of a candlestick is colored in a way to depict if the price increased or decreased at that period. Therefore, we select different colors for bullish and bearish candles. The top and bottom of the body shows the opening and closing prices, while the thin lines above and below the ‘’body’’ indicate the highest and lowest prices reached. These thin lines are called “wicks” or “shadows”.
Point and Figure Charts
Point and figure charts focus only on price movements while ignoring time and volume. They use Xs and Os to indicate upward and downward price movements.

Traders should know that there are many other chart types (e.g. Renko, Heikin-Ashi, etc), which create different representations of prices using specific filters and calculations.
Each trader should select the trading chart which best suits his/her trading strategy, style and preferences. It is also very common to use a combination of different chart types for better analysis and decision making.